
Sleep, Stress, and Lifestyle Data Visualization
Project Goal
To understand how sleep quality, physical activity, stress levels, and lifestyle factors such as gender, occupation, and BMI relate to one another—using Tableau to uncover meaningful patterns and potential product opportunities.
Process
-
Data Overview & Cleaning
Source: Kaggle – Sleep Health and Lifestyle Dataset
Cleaned and structured the data for analysis, addressing missing values and ensuring consistency across lifestyle and biometric variables (e.g., activity level, sleep disorders, BMI).
-
Correlation Analysis
Explored potential relationships between variables such as sleep duration, stress level, heart rate, daily steps, and sleep quality.
Used scatter plots and dual-axis line charts to detect patterns (e.g., non-linear link between activity level and stress).
-
Dashboard Construction in Tableau
Designed a multi-panel Tableau dashboard to visually communicate key findings.
Highlighted areas where sleep quality varied by occupation, and where stress patterns diverged based on activity levels and step count.
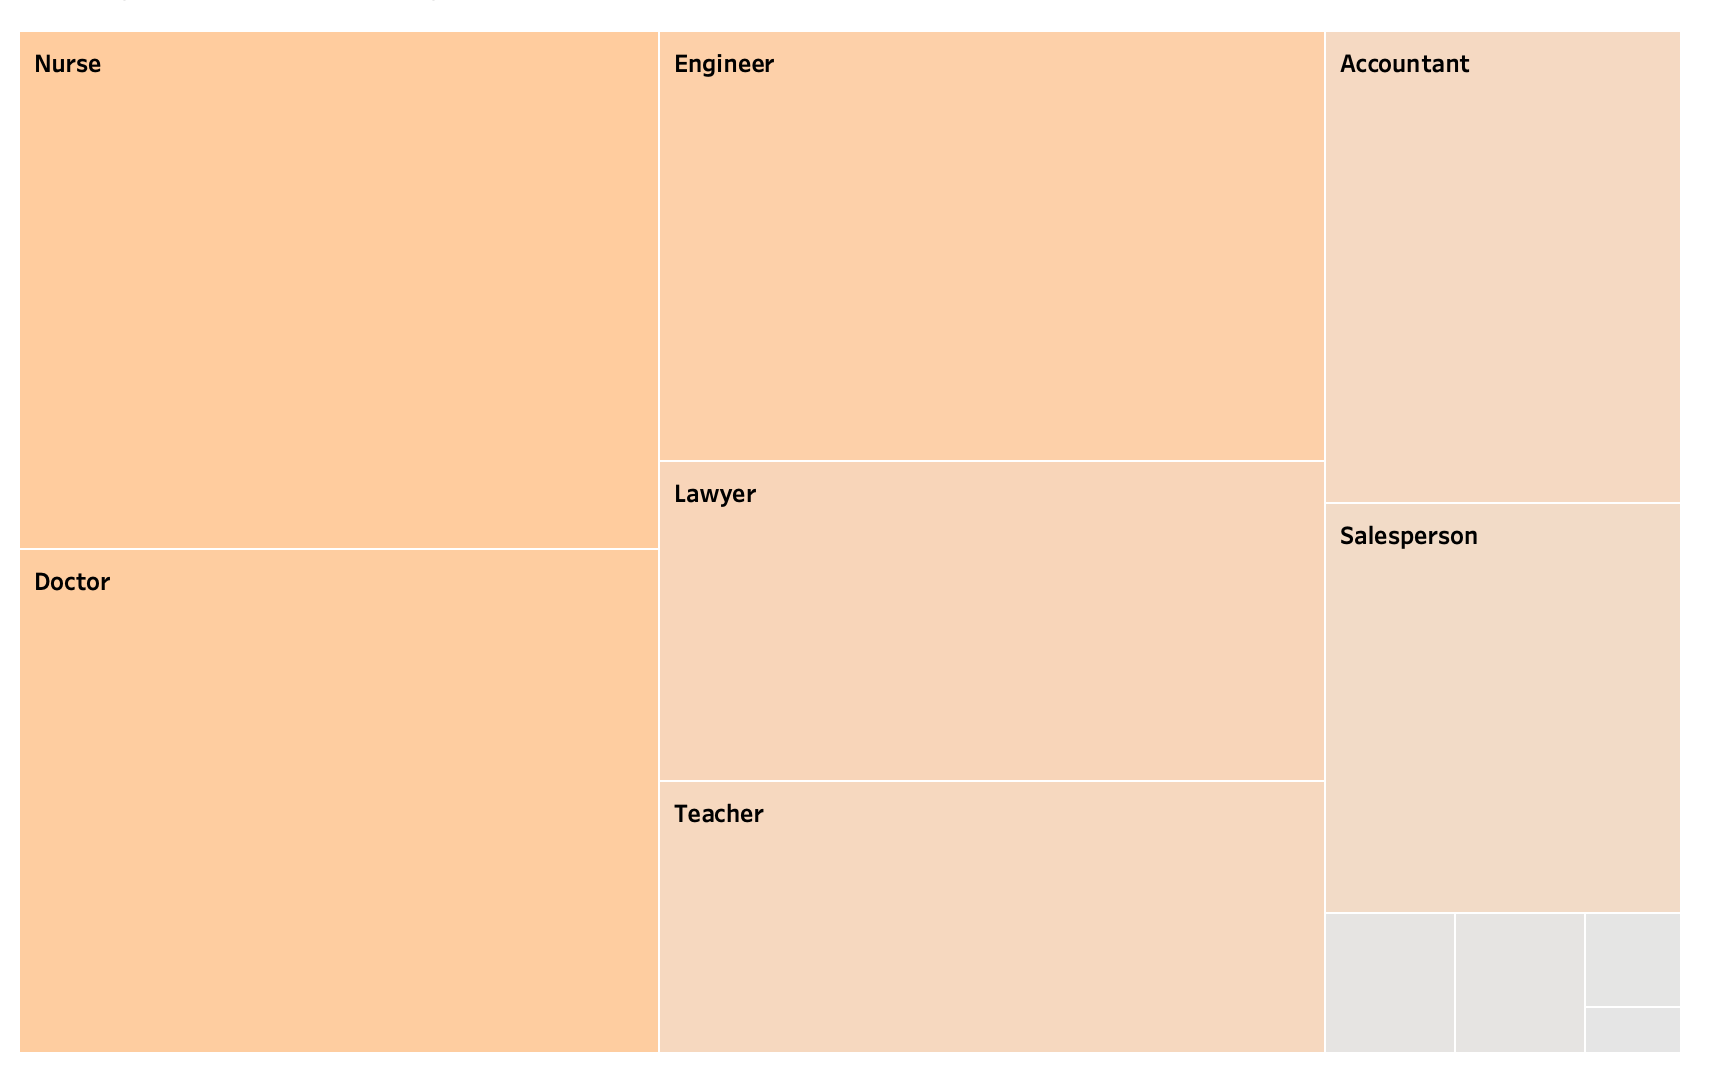
Gender Distribution & Occupation
The database has fairly balanced gender split (189 Male, 185 Female).
The most common occupations are nurse, followed by Sales Representative and Doctor.
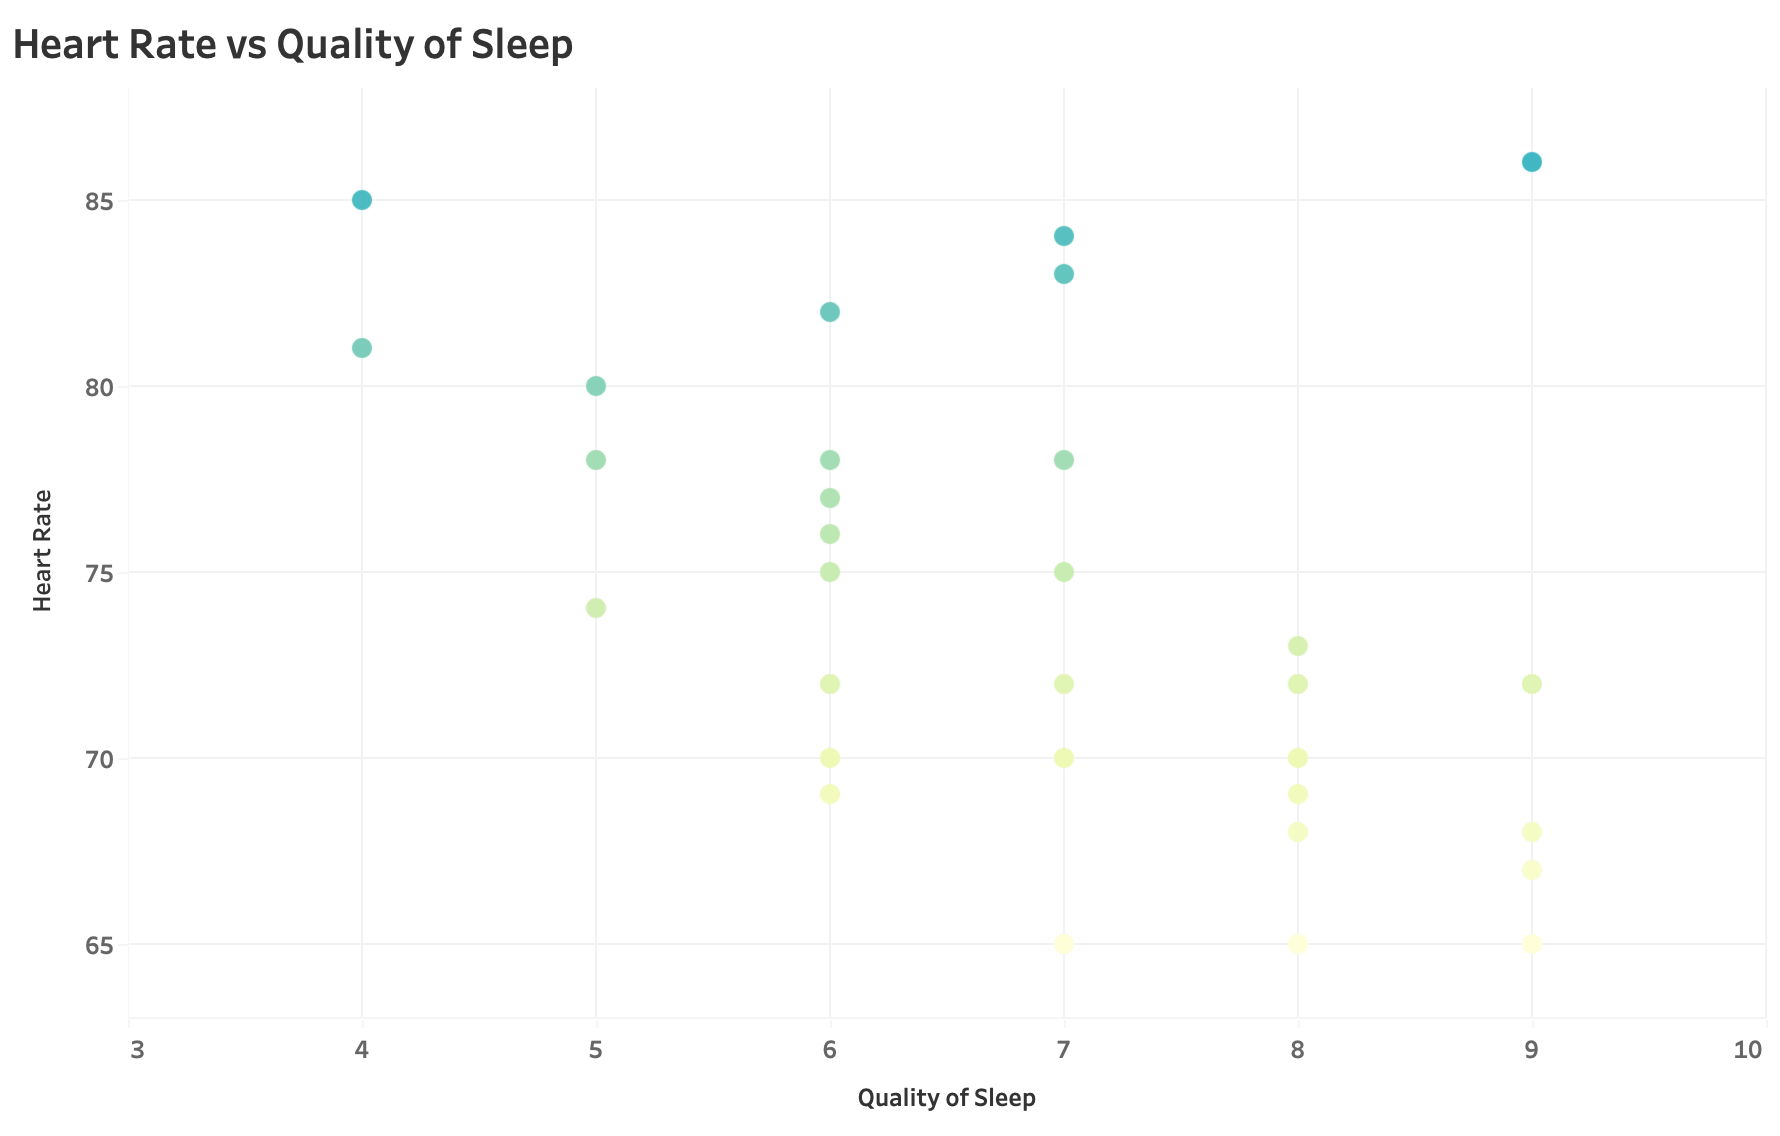
Sleep Quality
Average sleep quality score: ~7.31 / 10
Strong enough variance to find patterns (range: 4–9).
The sleep quality is slightly correlated to physical active levels.
Occupations such as sales, Scientists, and Nurses showed lower average sleep quality and higher stress.


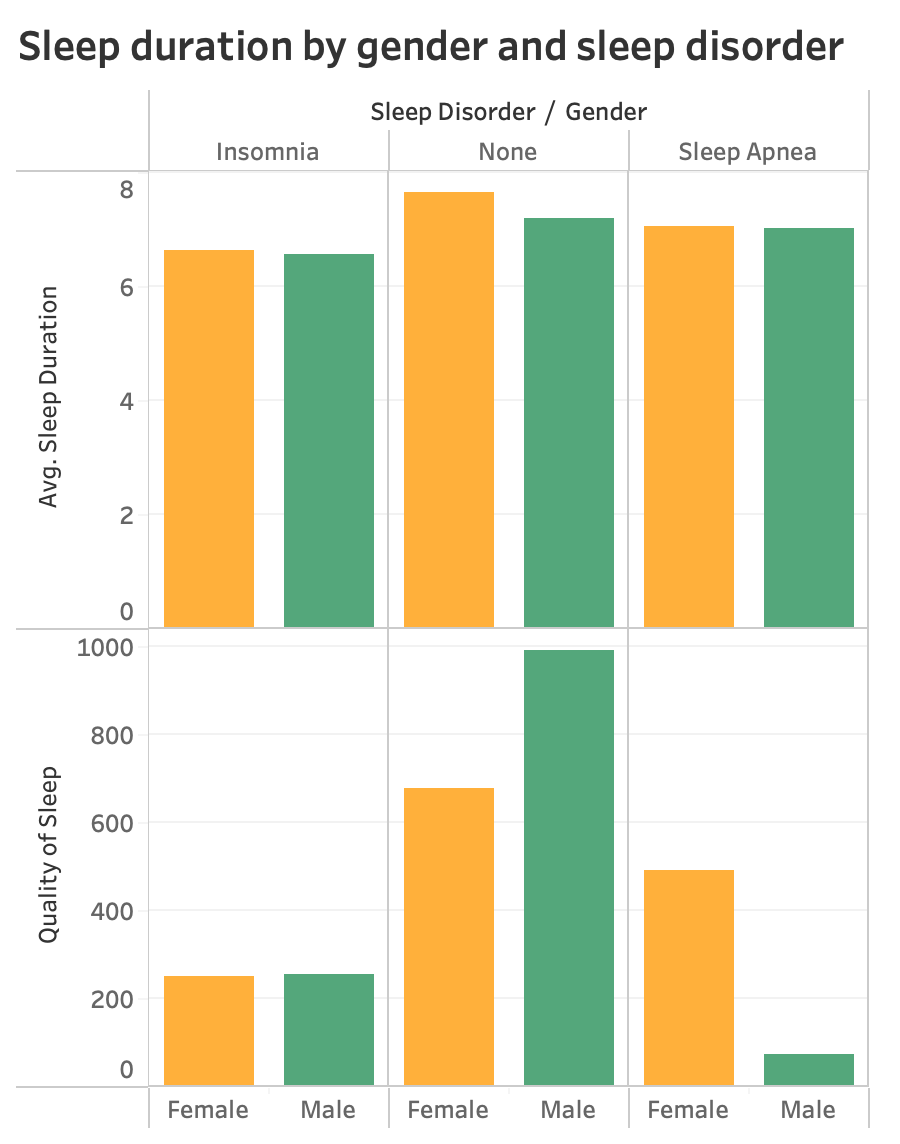
Sleep Duration
Average sleep duration: ~7.13 hours
Range: 5.8 to 8.5 hours
Sleep disorders affect both the duration and quality of sleep for men and women
Sleep quality and sleep duration are positively correlated: the longer the sleep, the better the quality of sleep

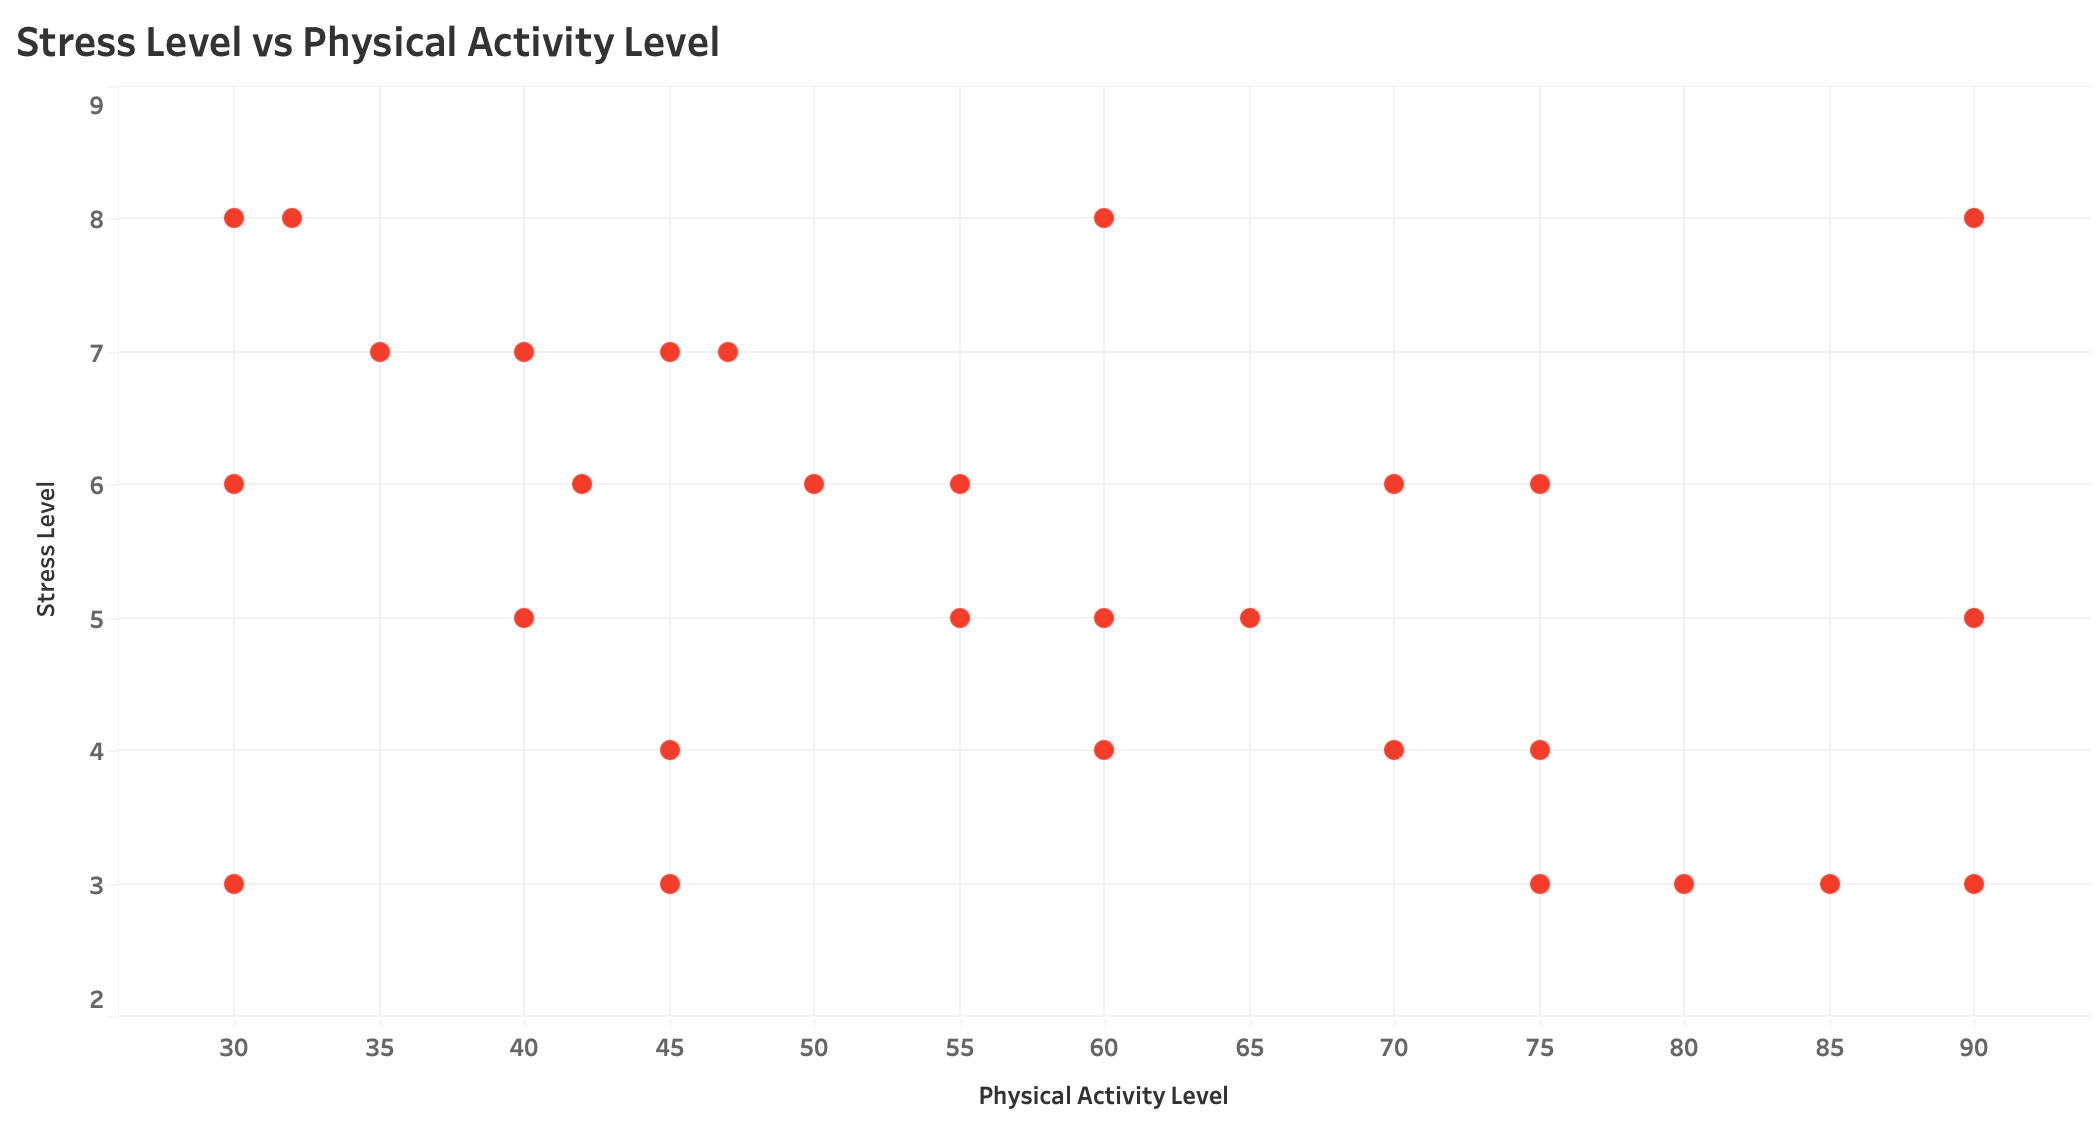
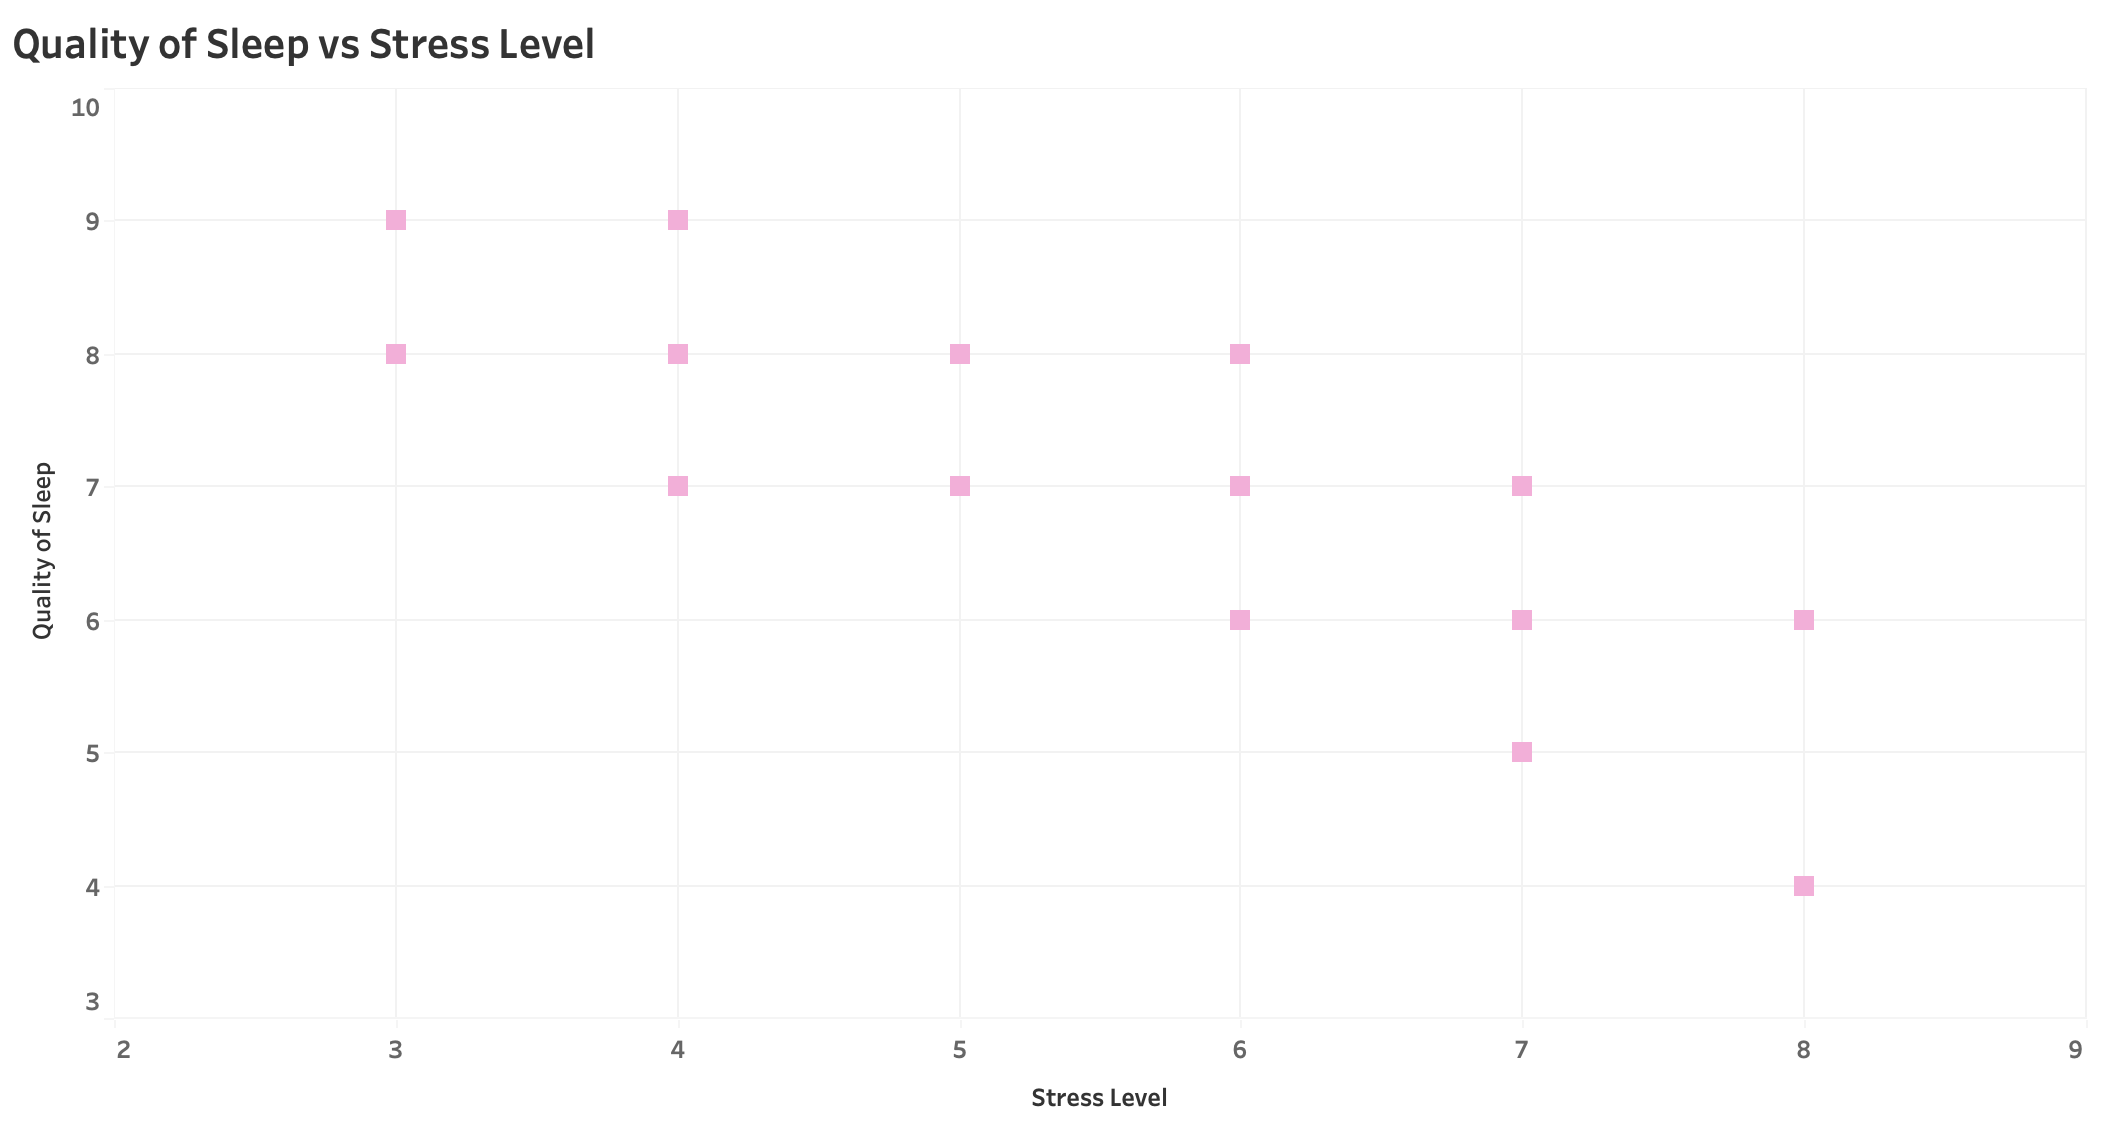
Stress Level
Physical activity level (range 30–90) shows a wide spread.
Avg stress level is 5.38, but varies greatly across individuals.
Moderate activity = lower stress; too little or too much = higher stress. There is no linear relationship
There is a negative relationship between stress and sleep quality. A lower stress level is associated with better sleep quality, and a higher stress level is associated with poorer sleep quality.
Ideas from data visualization
Design Around the “Wellness Sweet Spot”
Moderate physical activity is linked to better sleep and lower stress, but too much activity can increase stress again. Products can be built to guide users toward a healthy, balanced rhythm, avoiding both inactivity and overexertion.
Tailor Wellness Tools to Lifestyle Profiles or Roles
Sleep and stress outcomes vary by occupation, BMI category, and even step count. This suggests potential for personalized wellness guidance based on life stage, job type, or behavior pattern—rather than generic “one-size-fits-all” wellness tips.
Products that Help Soothe Stress Before or During Sleep
The data shows a clear link between higher stress and lower sleep quality. This points to an opportunity for solutions that help users wind down—whether through calming routines, ambient tools, or behavior nudges—particularly in the evening or after high-stress days.