Fitness tracker Consumer Survey Analysis
This analysis aimed to explore how fitness wearables impact users’ exercise routines, motivation, and overall well-being. The survey focused on understanding the relationship between usage patterns and perceived health benefits.
Data Source: Kaggle
Analysis Method: Python

Process Overview
-
1. Initial Inspection & Cleaning
Evaluated columns such as age, gender, education, occupation, and fitness habits.
Cleaned data by renaming columns for clarity and filtering out any inconsistent or null entries.
-
2. Demographic Analysis
Plotted age and gender distribution using pie charts.
Found a varied age range and a nearly balanced gender breakdown.
-
3. Tracker Usage Trends
Assessed how long respondents had used fitness trackers and how frequently they used or checked them.
Created categorical orderings for comparison and visualized usage with bar charts and heatmaps.
-
4. Impact Evaluation
Standardized and analyzed responses to 9 impact areas, including motivation, engagement, health, sleep, and community connection.
Responses were reclassified into a unified scale: Very Negative to Very Positive.
Visualized using facet grids to assess perception across multiple dimensions.
-
5. Cross Analysis
Compared enjoyment of exercising with how often users tracked their data using heatmaps.
-
6. Insights Summary and Ideation
Identified key patterns such as positive correlation between usage frequency and enjoyment.
Noted drop-off in long-term engagement and inconsistent user feedback structures.
Brainstormed product opportunities and UX strategies grounded in the behavioral data.
Initial Inspection & Cleaning
Input
import pandas as pd
import numpy as np
import matplotlib.pyplot as plt
import seaborn as sns
import scipy.stats as stats

df = pd.read_csv('survey 605.csv')
print(df.head())
print(df.columns)
print(df.count())
print(df.describe())
Output
Index(['Timestamp', 'What is your age?', 'What is your gender?',
       'What is your highest level of education?',
       'What is your current occupation?',
       'How often do you exercise in a week?',
       'How long have you been using a fitness wearable?',
       'How frequently do you use your fitness wearable?',
       'How often do you track fitness data using wearable?',
       'How has the fitness wearable impacted your fitness routine?',
       'Has the fitness wearable helped you stay motivated to exercise?',
       'Do you think that the fitness wearable has made exercising more enjoyable?',
       'How engaged do you feel with your fitness wearable?',
       'Does using a fitness wearable make you feel more connected to the fitness community?',
       'How has the fitness wearable helped you achieve your fitness goals?',
       'How has the fitness wearable impacted your overall health?',
       'Has the fitness wearable improved your sleep patterns?',
       'Do you feel that the fitness wearable has improved your overall well-being?',
       'Has using a fitness wearable influenced your decision? [To exercise more?]',
       'Has using a fitness wearable influenced your decision? [To purchase other fitness-related products?]',
       'Has using a fitness wearable influenced your decision? [To join a gym or fitness class?]',
       'Has using a fitness wearable influenced your decision? [To change your diet?]'],
      dtype='object')
dtype: int64
Thoughts:
The dataset is predominantly surveying wearable/fitness tracker users (no yes/no questions about fitness trackers)
The questions are mainly designed to evaluate fitness trackers' impact on workout routines
Missing important features like location (suburb vs urban), type of fitness trackers, etc
The database is best for evaluating the correlation between health habits and frequency/time use of the tracker
The database has limited data (only 30 entries) so the result should be treated as a reference only
Cleaning needs:
Remove empty or error logs
Filter the ones without trackers
Data types
2. Demographic Analysis
Input
# rename the dataframe for easier calling
df_new = df.rename(columns={
    'Timestamp': 'timestamp',
    'What is your age?': 'age',
    ... (hidden)
}, inplace=False)

# print the new columns
print(df_new.columns)

# start with examining the empty or error data
# print(df_new[df_new.isnull().any(axis=1)])

# examine the age data in this table
colors = sns.color_palette("pastel")

plt.pie(df_new.age.value_counts(),
        labels=df_new.age.unique(),
        colors = colors,
        autopct='%1.1f%%',
        startangle=90)
plt.axis('equal')
plt.title('Age information of the survey respondents')
plt.show()

# examine the gender data
colors = sns.color_palette("Paired")

plt.pie(df_new.gender.value_counts(),
        labels=df_new.gender.unique(),
        colors = colors,
        autopct='%1.1f%%',
        startangle=90)
plt.axis('equal')
plt.title('Gender information of the survey respondents')
plt.show()
Output


3. Tracker Usage Trend
Input
# examine the tracker_use_time column aka who has trackers
print(df_new.tracker_use_time.unique())

# create a ranking of the categorical description
order_tracker_use_time = ['Less than 6 months' ,'6-12 months', '1-2 years' ,'More than 2 years']
df_new.tracker_use_time = pd.Categorical(df_new.tracker_use_time, categories=order_tracker_use_time, ordered=True)
print(df_new.tracker_use_time.describe())

# create a box gram to examine the distribution
plt.bar(order_tracker_use_time, df_new.tracker_use_time.value_counts())
plt.xlabel('How long the tracker has been owned')
plt.ylabel('Number of responses')
plt.show()
Input
# tracker owning vs age
plt.scatter(df_new.age, df_new.tracker_use_time)
plt.show()

Input
# inspect frequency column and assign orders
print(df_new.tracker_use_frequency.unique())

order_tracker_use_frequency = ['Rarely','1-2 times a week','3-4 times a week','Daily']
df_new.tracker_use_frequency = pd.Categorical(df_new.tracker_use_frequency, categories=order_tracker_use_frequency, ordered=True)
print(df_new.tracker_use_frequency.describe())

plt.bar(order_tracker_use_frequency, df_new.tracker_use_frequency.value_counts())
plt.xlabel('How frequently do you use the tracker')
plt.ylabel('Number of responses')
plt.show()
Input
# plot usage time vs frequency

plt.clf()
cross_tab = pd.crosstab(df_new.tracker_use_time, df_new.tracker_use_frequency)
sns.heatmap(cross_tab, annot=True, cmap='flare')
plt.gca().invert_yaxis()
plt.xlabel('How frequently the tracker is used')
plt.ylabel('How long the tracker has been owned')

plt.show()
Input
# create jitter
x_jitter = np.random.normal(0, 0.1, len(df_new.tracker_use_time))
y_jitter = np.random.normal(0, 0.1, len(df_new.tracker_use_frequency))

# add numerical values to categories for plotting
df['usage_num'] = pd.Categorical(df_new.tracker_use_time).codes
df['frequency_num'] = pd.Categorical(df_new.tracker_use_frequency).codes

plt.scatter(df['usage_num'] + x_jitter, df['frequency_num'] + y_jitter)
plt.xticks(ticks=range(len(order_tracker_use_time)), labels=order_tracker_use_time, rotation=45)
plt.yticks(ticks=range(len(order_tracker_use_frequency)), labels=order_tracker_use_frequency)
plt.title('Scatter Plot with Jitter for Categorical Variables')

plt.show()
Input
# examine the responses of data tracking frequency
print(df_new.tracker_data_track_frequency.unique())

# oder the labels
order_data_track_frequency = ['Rarely','Once a month','Once a week','Every other day','Every day']
df_new.tracker_data_track_frequency = pd.Categorical(df_new.tracker_data_track_frequency, categories=order_data_track_frequency, ordered=True)

print(df_new.tracker_data_track_frequency.describe())

# create a graph
plt.bar(order_data_track_frequency, df_new.tracker_data_track_frequency.value_counts())
plt.xlabel('How frequently do you track data')
plt.ylabel('Number of responses')
plt.show()
4. Impact Evaluation
Input
columns = ['tracker_routine_impact',
       'tracker_motivation_impact', 'tracker_enjoyable_impact',
       'tracker_engagement_impact', 'tracker_community_impact',
       'tracker_goal_impact', 'tracker_health_impact', 'tracker_sleep_impact',
       'tracker_wellbeing_impact']

df_evaluation = df_new[columns]
#print(df_evaluation.describe())
#print(df_evaluation.tracker_motivation_impact.unique())


# melt df_evaluation into a bigger dataframe
df_evaluation_melt = df_evaluation.melt(var_name='Question', value_name='Response')
#print(df_evaluation_melt.describe())

# update the responses to be consistent
#print(df_evaluation_melt.Response.unique())
response_update = ['Very negative impact','Negative impact','Neutral impact','Positive impact','Very positive impact','Not sure']

replace = {
    'Negatively impacted my fitness routine':'Negative impact',
    'No impact on my fitness routine':'Neutral impact',
    ...
}

df_evaluation_melt['Response'] = df_evaluation_melt['Response'].replace(replace)
print(df_evaluation_melt.Response.unique())

# create a big graph of all of the questions

graph = sns.FacetGrid(df_evaluation_melt, col="Question", col_wrap=3, sharey=False, sharex=False)
graph.map(sns.countplot, "Response", order=response_update)

#plt.xticks(ticks=range(len(response_update)), labels=response_update, rotation=45)
for ax in graph.axes.flat:
    ax.set_xticks(range(len(response_update)))
    ax.set_xticklabels(response_update, rotation=45, ha='right',fontsize=8)
graph.set_titles("{col_name}")
plt.tight_layout(pad=3)

plt.show()


5. Cross Analysis
Input
plt.clf()
cross_tab = pd.crosstab(df_new.tracker_data_track_frequency, df_new.tracker_enjoyable_impact)
sns.heatmap(cross_tab, annot=True, cmap='flare')
plt.gca().invert_yaxis()
plt.xlabel('How frequently do you track fitness data')
plt.ylabel('Do you think that the fitness wearable has made exercising more enjoyable?')

plt.show()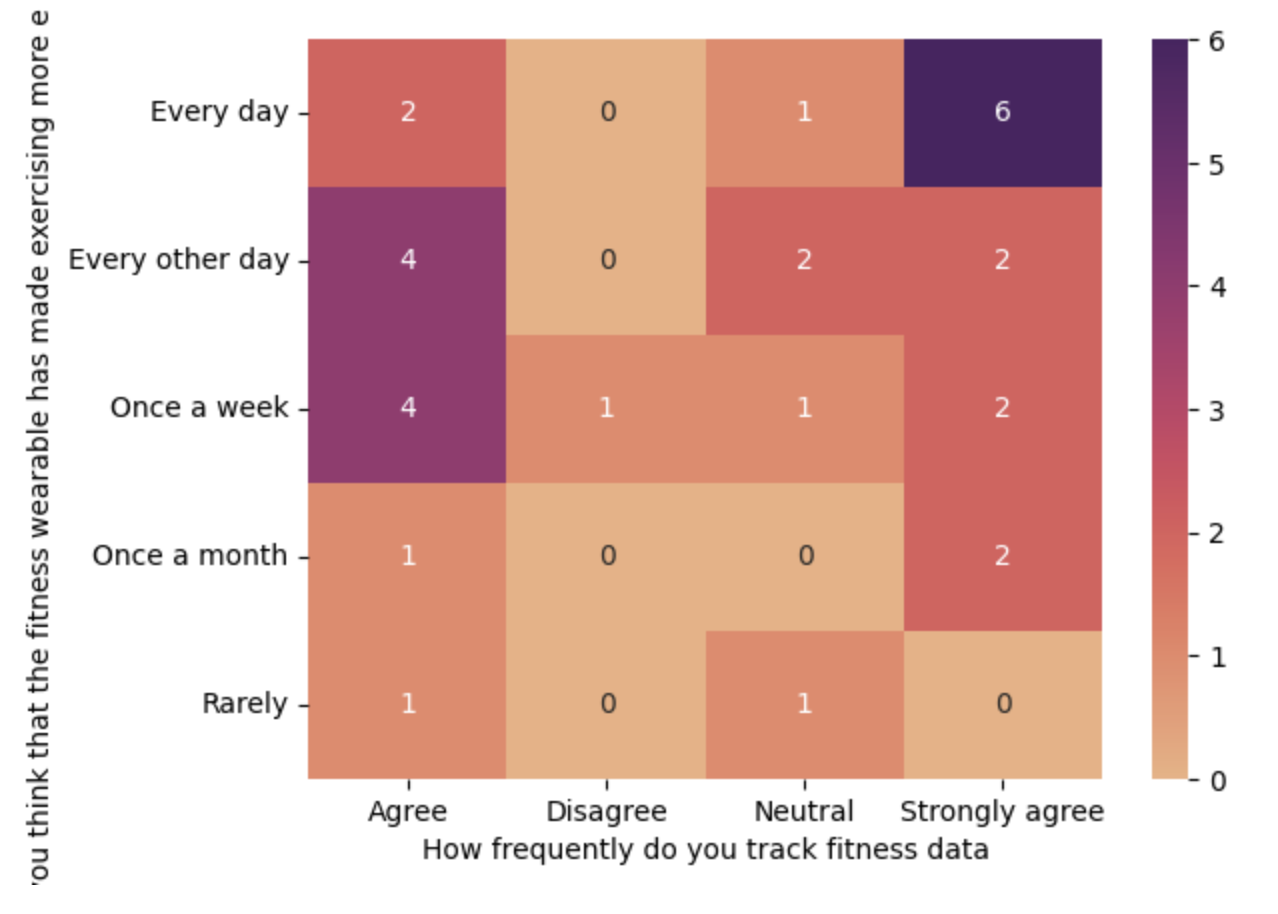
6. Insights Summary and Ideation

Highlights
Most users felt positively about how wearables impacted motivation, goal achievement, and health.
Daily users tended to report the most positive outcomes.
Usage drops after 1–2 years, though the sample size beyond that is too small to confirm a trend.
Wearables were strongly linked to increased fitness tracking and greater enjoyment of workouts.

limitation
Only 30 responses, with just 2 users reporting over 2 years of tracker usage.
Inconsistent answer formatting made cleaning harder.
Survey lacked a control group (non-wearable users) for stronger insights.
Product Strategy Recommendations
Encourage Early Engagement
Most value and motivation are felt in the first year—design onboarding experiences that reinforce early wins and consistent tracking.
Re-engage Long-Term Users
Usage dips after 1–2 years. Develop “milestone programs” or advanced challenges to re-spark interest for long-time users.
Simplify UX with Consistent Feedback
Align product questionnaires, feedback loops, and user check-ins using consistent response types for easier longitudinal analysis.
Design for Habit-Forming Routines
Users who tracked data daily found workouts more enjoyable. Highlight progress and send nudges that reward consistency.
Add Community-Driven Features
Many users felt more connected to the fitness community. Expand social sharing, virtual classes, or achievement boards.
